The open platform for agriculture.
One platform from the plan to the machine to the record, working with the machinery and file formats you already own, and letting your data leave in them whenever you want.
Designs bound to real ground, and analysis that refuses to guess.
Author your design, or import the fieldbook your statistician already made. Place it with a seeded randomisation you can reproduce, then drive the plots with the seeder, sprayer or plot splitter you already own. Every reading carries who took it and where the value came from, and when the design cannot support an honest error term, Fieldbase says so rather than printing letters.
Free to try. A built-in drive simulator lets you run a complete field before you connect any hardware.
Real trials on client ground, not demonstrations by eye.
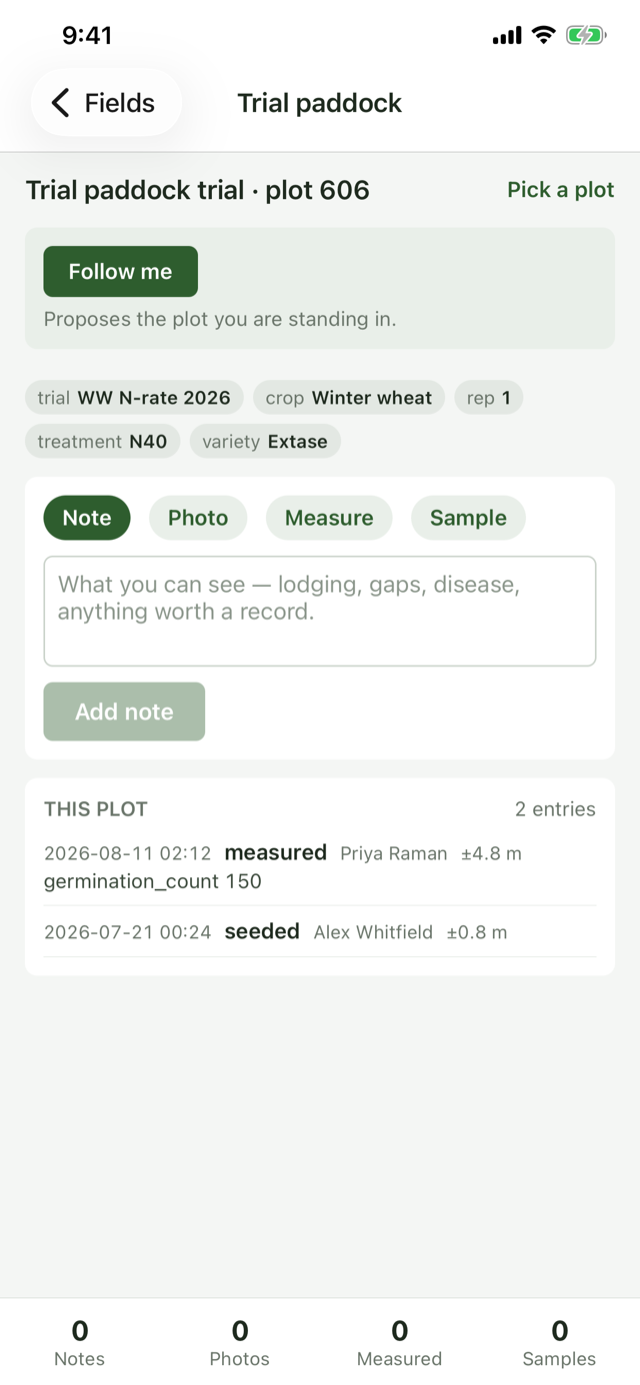
Lay out, drive and measure proper trials on a client's own fields with the client's own machinery. Your staff share one organisation across every device, the phone proposes the plot under your feet and records with no signal needed, and what you hand over says who measured what, where, and how sure to be about it.
Free to try. Collection runs on the phone in your pocket or in its browser, and neither needs signal.
Every record on the right field, and your own machinery doing the precise work.
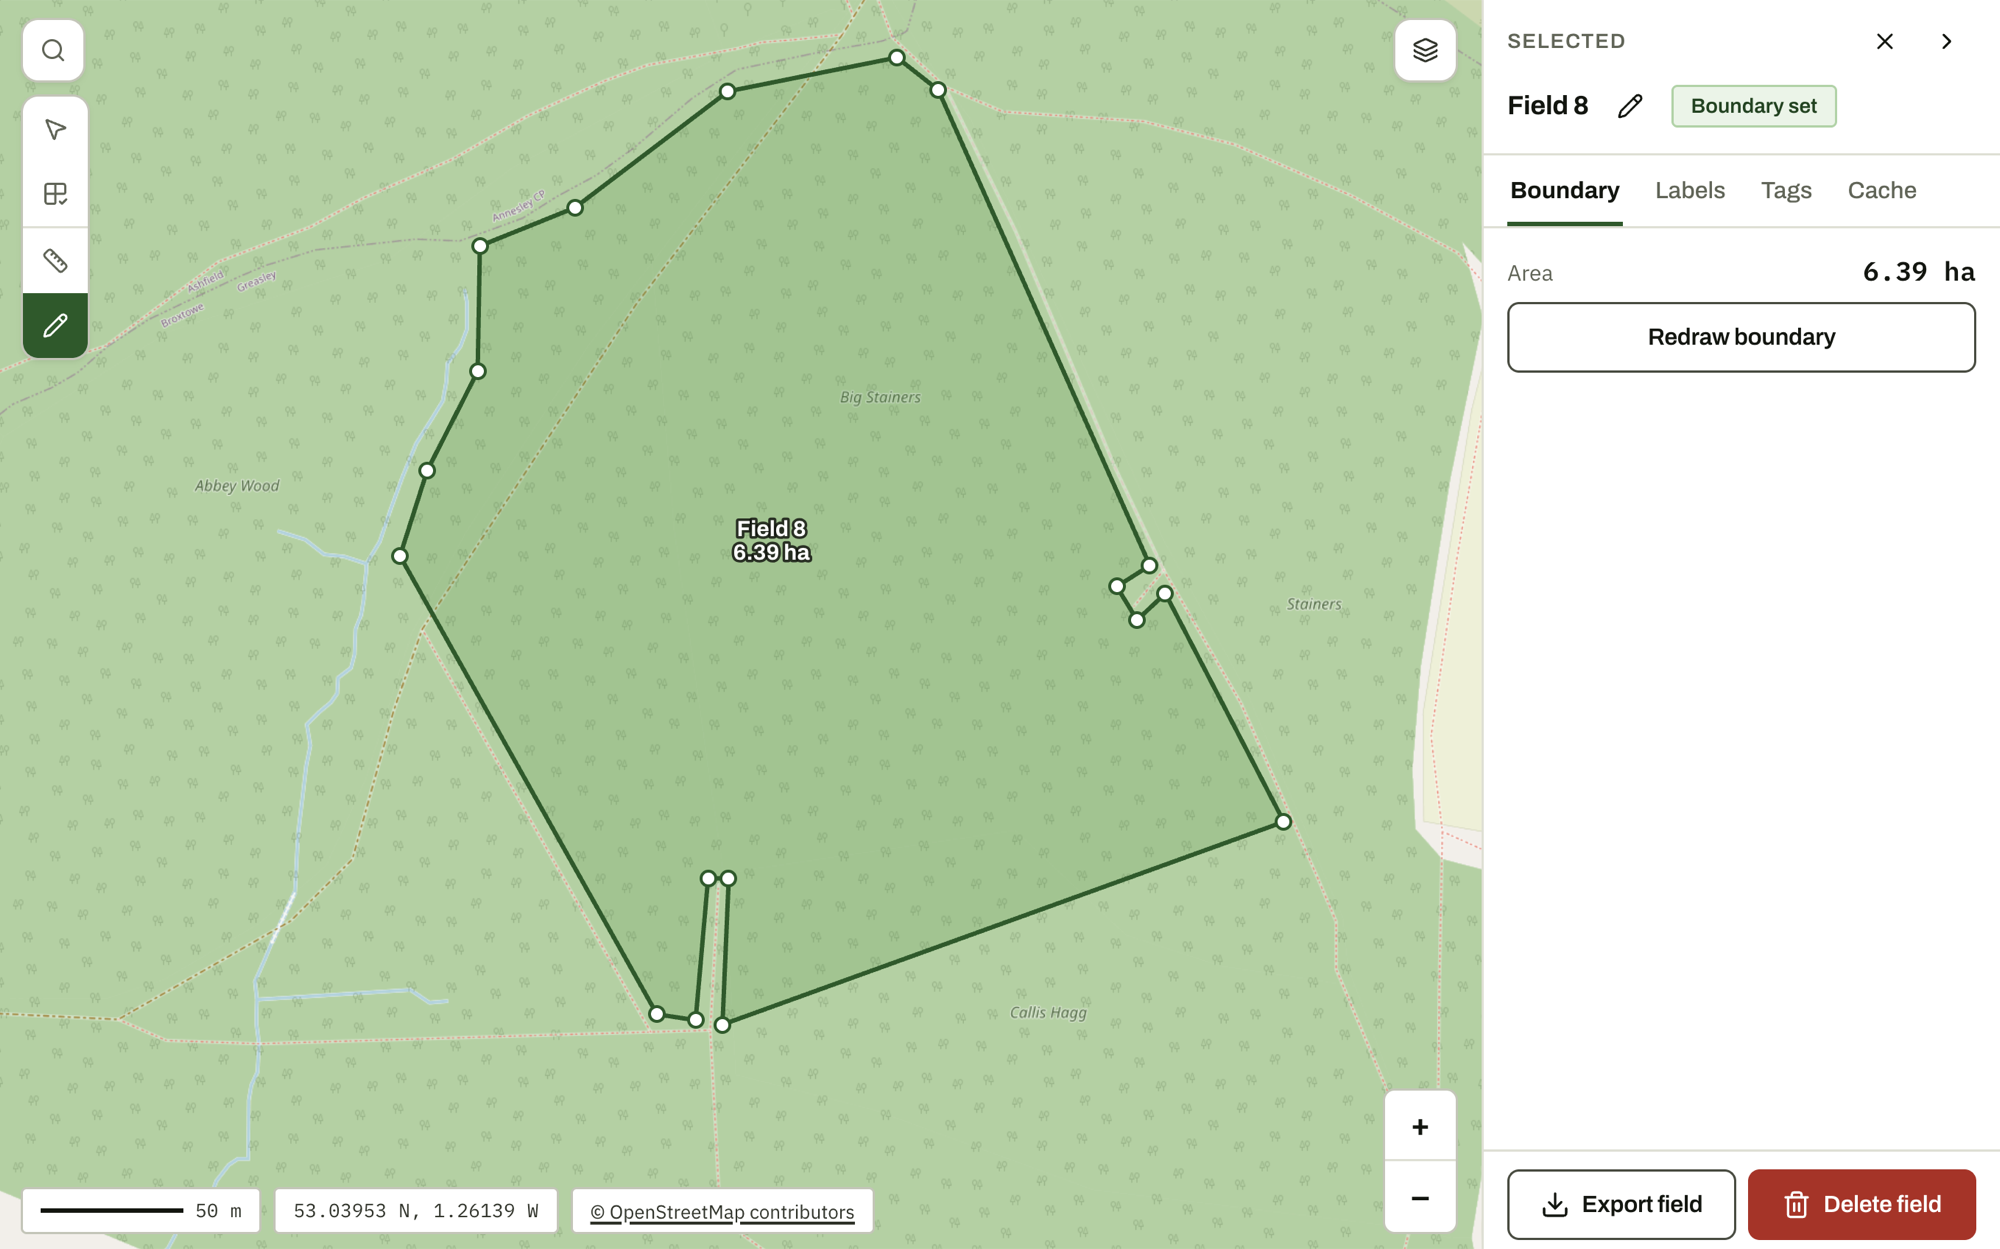
Import the boundaries you already have or draw them on satellite imagery. Notes, passes and readings land on the field, or the part of one, they belong to, offline, and Fieldbase drives the precision work through the tractor and drill you already own. No new terminal, no corrections lock-in, and your data leaves whenever you want.
Free to try, and the map, import and export are in every plan, including the trial.
Accurate plots on the ground
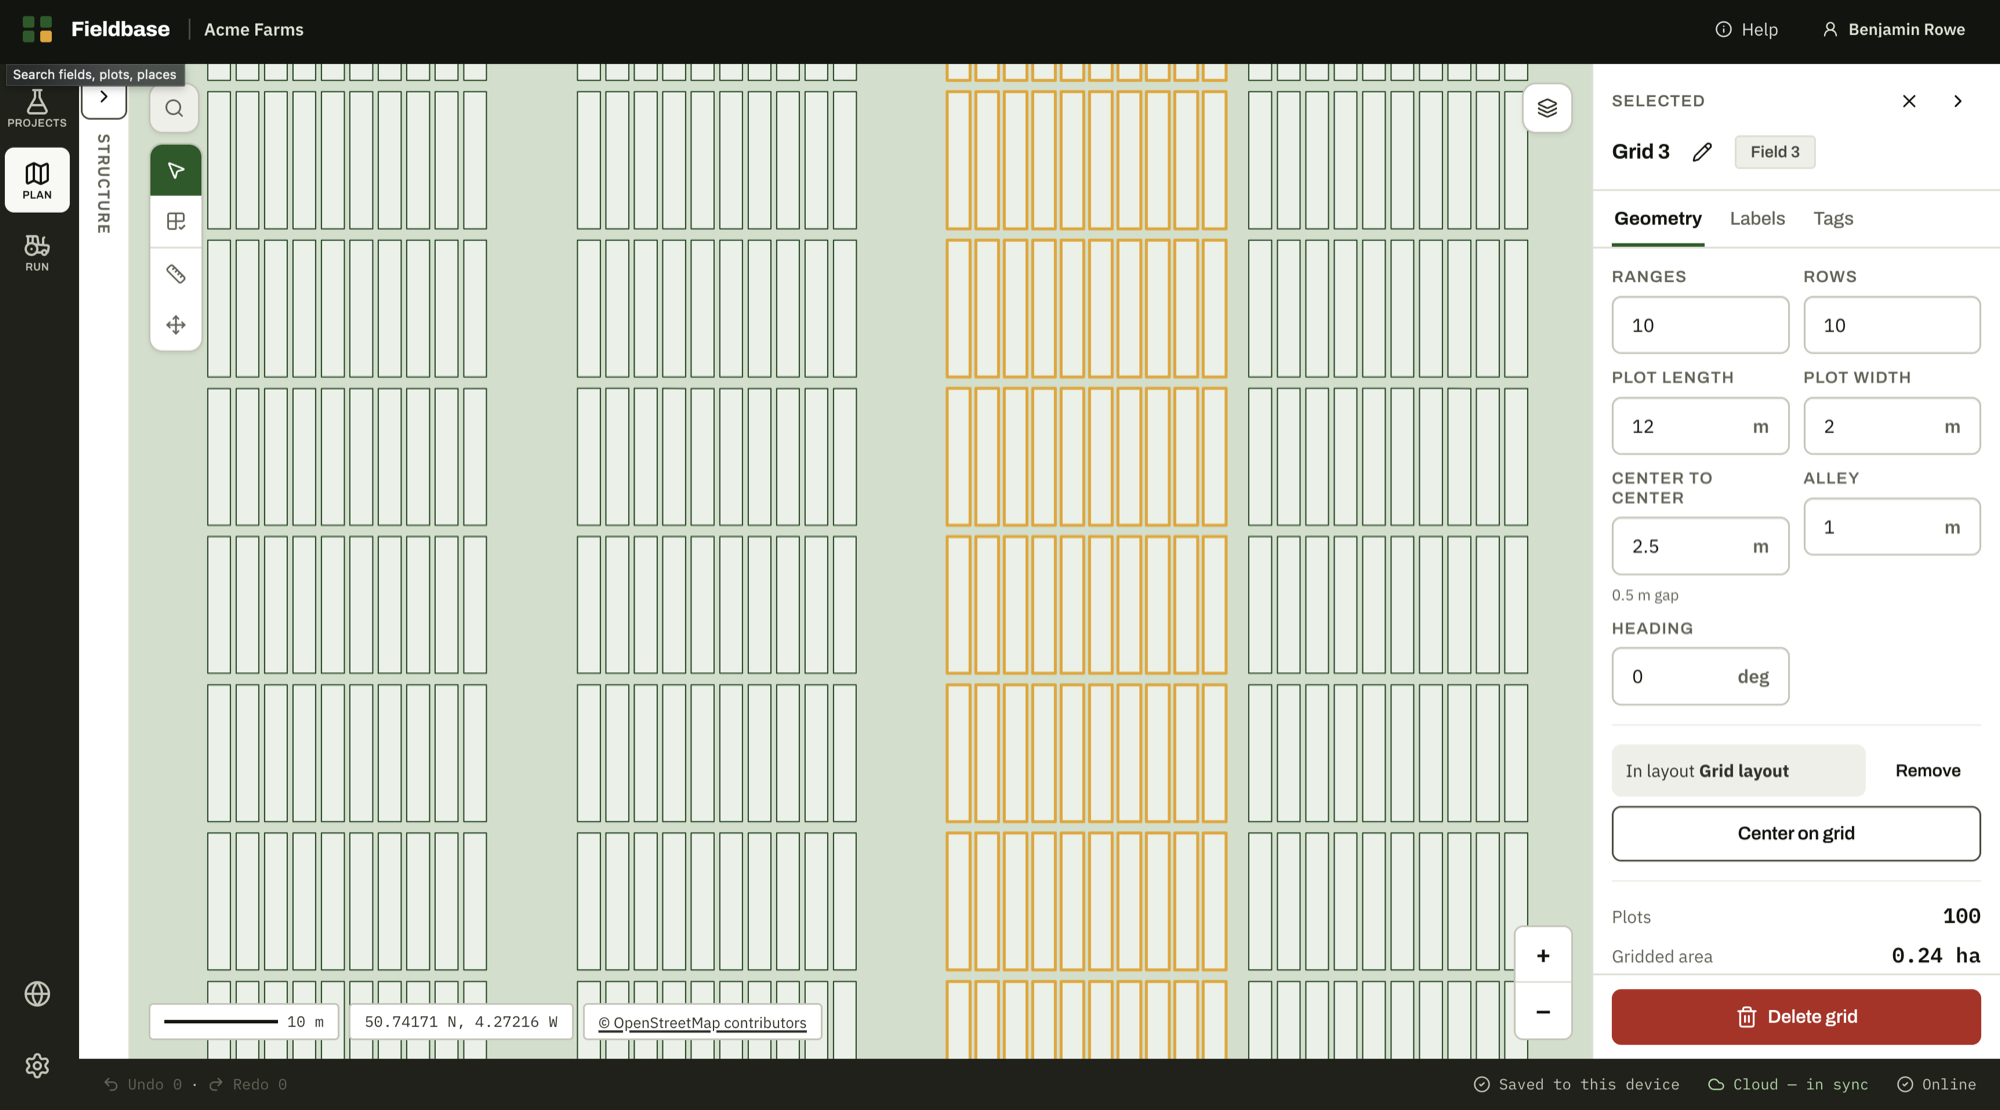
You enter the plot size, the alley, the heading and your machine’s working width. Fieldbase generates the grid, numbers it and works out the walk order from those figures. The geometry is computed in a local projection, so plot dimensions are correct at any latitude and on any bearing.
Nothing is assumed on your behalf
Range and row mean different things in different tools, so Fieldbase proposes a column mapping and waits for you to confirm it. Discards and plots cut off by the boundary remain in the model, so your plot numbering does not change part-way through a season.
Record once, export in the format you need
Import the boundary and the trial design you already hold. Take readings directly from scales, moisture meters and NIR instruments over serial. Export to shapefile, ISOXML, KML, GeoJSON, XLSX, CSV or BrAPI at any time, on any subscription.
Built for the people who run the plots
Research organisations
Trials units, breeders and researchers: designs bound onto real geometry, provenance on every reading, and analysis that refuses to guess.
Read moreAgronomists and advisors
Firms running trials and demonstrations across client farms: one organisation, every device, and a record you can stand behind.
Read moreFarms
The farm mapped, every record against the right field or part of one, and your own machinery doing the precise work, with no new terminal.
Read moreWhere you save time
Setting out plots with a tape and pegs
Enter the dimensions once. Fieldbase generates the grid, numbers it to match your fieldbook, and sets the walk order.
Preparing a layout your terminal will accept
Export ISOXML TASKDATA.XML with one Partfield per plot. Plots are individually selectable on GreenStar, Fendt and CNH terminals.
Counting passes and operating the machine by hand
Fieldbase fires each output as you cross the plot edge, allowing for the actuation delay of your machine. If you leave a block part-finished, it resumes where you stopped.
Typing up a fieldbook in the evening
Observations are recorded against the plot as you take them, with the operator and the source of each reading. Reports are calculated from those records, so there is no spreadsheet to maintain.
Fieldbase keeps track of the plots while you drive
The screen names the plot you are approaching rather than the one you have passed. Each output fires as you cross the plot edge, timed to allow for the delay in your machine, and a jittering GPS fix cannot trigger the same plot twice.
If fix quality drops, Fieldbase disarms and returns every output to a safe state. Outputs cannot fire until you have completed the preflight check and armed the system, and a trigger that has been missed is never fired late.
See the screens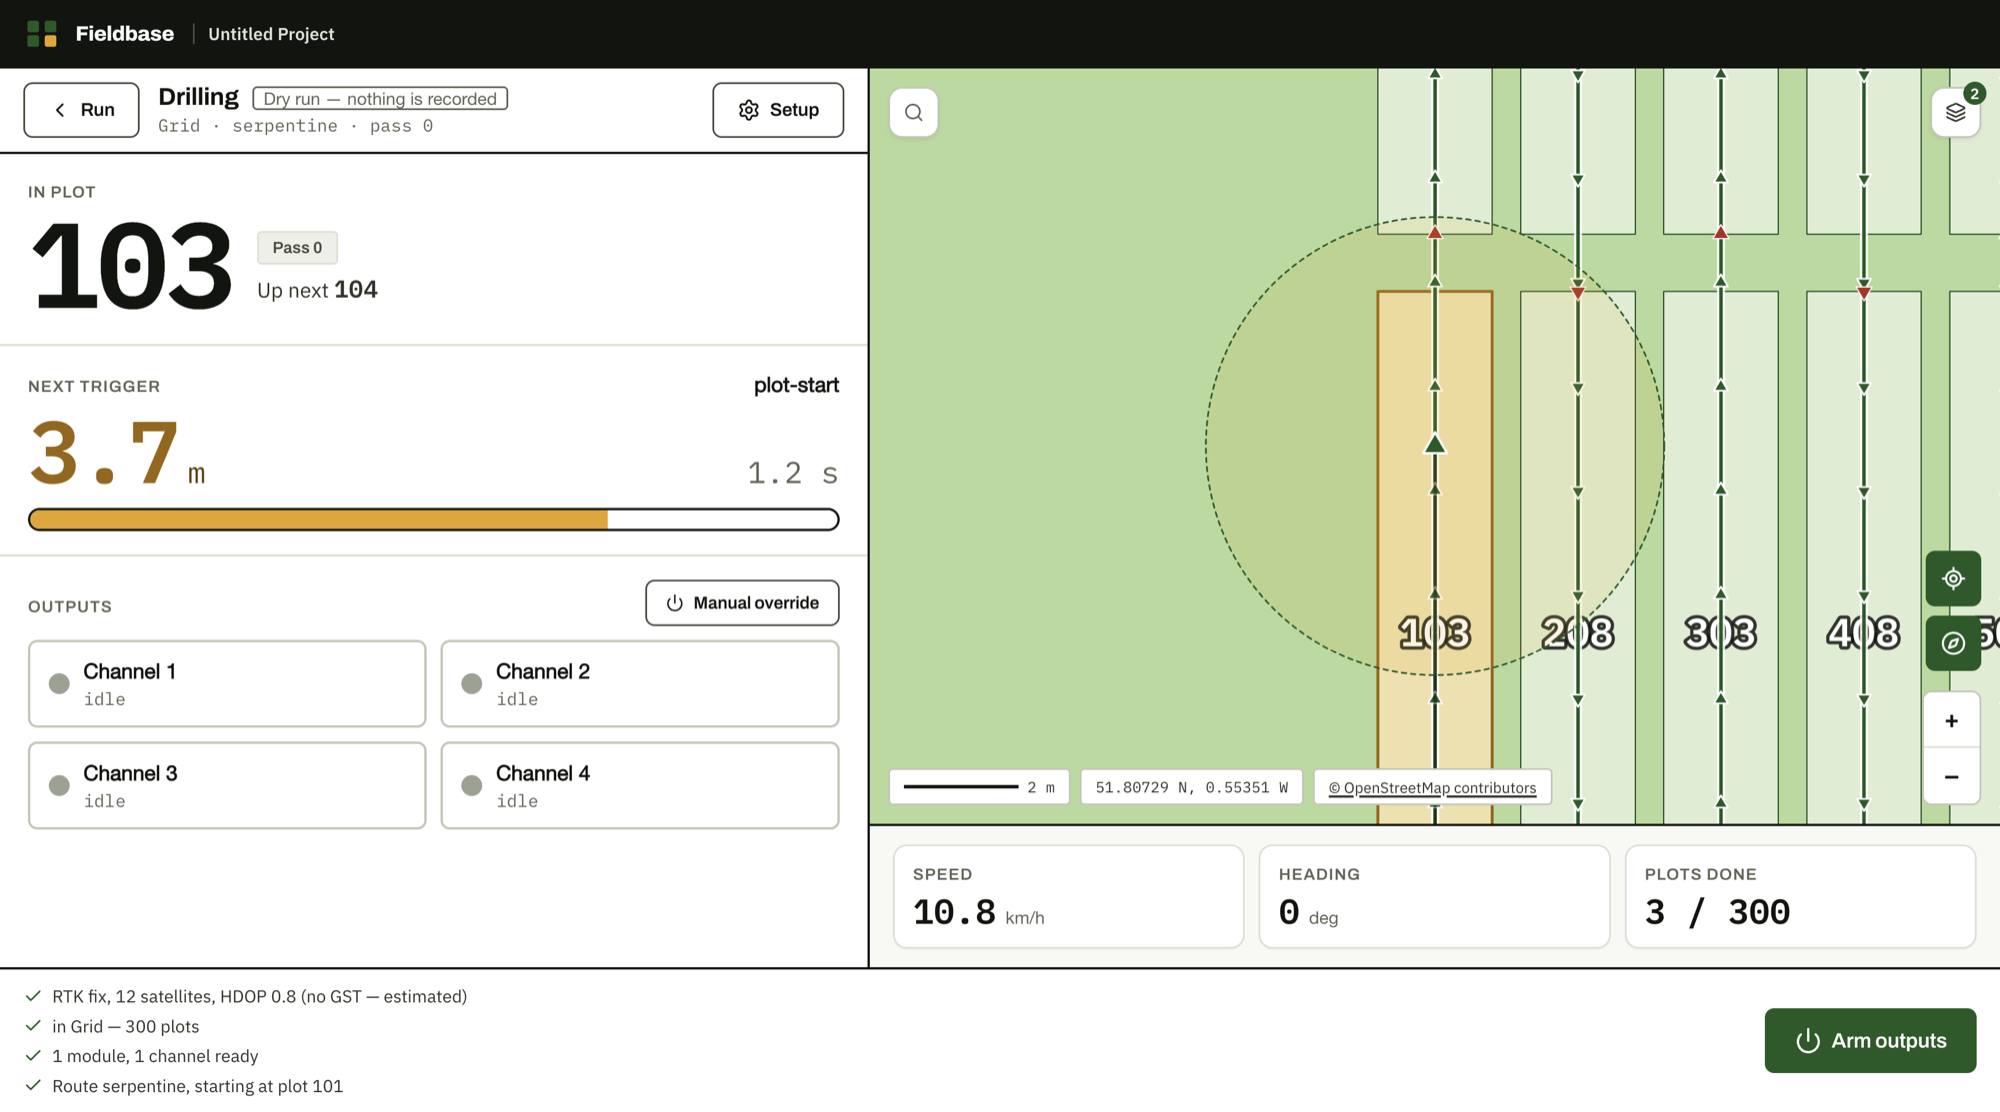
Try it before you commit to hardware
Import what you already have
Field boundaries import from shapefile, KML and GeoJSON. An existing layer of plots is analysed to recover the grid that produced it, including origin, bearing, rows and numbering, so a previous season can be edited rather than redrawn.
Run it without a GPS receiver
A drive simulator and NMEA log replay run the complete pipeline on a laptop. You can drive a full field and watch every output channel fire before you order any hardware.
Correct mistakes easily
Every action can be undone, including bulk edits: a whole selection moves and returns in a single step. Values outside the expected range are flagged but never blocked, and a retracted observation is marked as withdrawn rather than deleted.
Common questions
Do I bring my own randomisation, or does Fieldbase design the trial?
Either. Fieldbase authors the designs it names (completely randomised, randomised complete block, Latin square, split plot and factorial) and places them with a stored seed, so a layout can be reproduced and defended a year later. It also works happily downstream of a design made elsewhere: import a fieldbook from ARM, agricolae, FielDHub, Breedbase or a statistician's spreadsheet and bind it onto the grid, so the geometry carries the identities your pipeline already knows.
Half my fields have no signal. Does it still work?
Yes. Pin the fields you are taking out and everything about them is held on the device before you leave the yard: the map, the plots and the season's records. Notes, readings and runs are recorded locally whether or not there is signal, and sync catches up on its own when you are back in coverage.
We run a mixed fleet, one make of tractor and another drill. Does that matter?
No. Fieldbase is deliberately brand-neutral: export ISOXML task data to GreenStar, Fendt, CNH and other ISOBUS terminals, or let Fieldbase operate the outputs itself through standard industrial hardware. Nothing requires the tractor, the implement and the software to share a badge.
If we stop paying, what happens to our seasons of work?
The application becomes read-only. It does not hide your work. Feature gating affects the interface only and never the data, so a project created with a paid feature keeps all of it and opens intact on an installation that never held that licence. Export is never gated, so a lapsed subscription cannot prevent you retrieving a season's data.